PBMC10K Multiome
[1]:
import numpy as np
import polars as pl
import snapatac2 as snap
import pandas as pd
import scanpy as sc
from scipy.sparse import csr_matrix
from scipy import sparse
import scipy.io
import os
import anndata as ad # Anndata version must > 0.8
import matplotlib.pyplot as plt
import seaborn as sns
sns.set_theme(style='white')

import scATAnno
from scATAnno.SnapATAC2_spectral import *
from scATAnno.SnapATAC2_tools import *
from scATAnno.SnapATAC2_utils import *
from scATAnno import scATAnno_preprocess
from scATAnno import scATAnno_assignment
from scATAnno import scATAnno_integration
from scATAnno import scATAnno_plotting

import warnings
warnings.simplefilter(action='ignore', category=FutureWarning)
warnings.simplefilter(action='ignore', category=DeprecationWarning)

default_28 = scATAnno_plotting.get_palettes("default28")
default_102 = scATAnno_plotting.get_palettes("default102")
In this tutorial, we apply PBMC reference atlas to PBMC 10K Multiome dataset. The input files are 1) reference atlas in h5ad format; 2) query data in mtx and tsv formats, whose features are aligned with PBMC reference peak.
Download reference data
[2]:
# !wget -O PBMC_reference_atlas_final.h5ad "https://www.dropbox.com/s/y9wc6h5mmydj7gf/PBMC_reference_atlas_final.h5ad?dl=1"
Download query data, including 1) scATAC (matrix.mtx, features.tsv and barcodes.tsv), features are the reference peak of PBMC reference atlas 2) scRNA (filtered_feature_bc_matrix.h5)
[3]:
# !wget -O PBMC10k_multiome_vPBMCatlas.zip "https://www.dropbox.com/s/3g63m832mbeec4s/PBMC10k_multiome_vPBMCatlas.zip?dl=1"
Donwload palette file
[4]:
# !wget -O reference_palette.pickle "https://www.dropbox.com/scl/fi/h9gryg9gwdegs8jaob8ga/reference_palette.pickle?rlkey=41zarytshwcowko0r7ndxkiih&st=bxgkyno9&dl=0"
We load reference atlas data and query data. Reference atlas is stored as h5ad AnnData in the data directory; query data is imported from QuickATAC output.
[5]:
os.chdir("scATAnno-main")

output_name = "PBMC_10K_Multiome"
out_dir = os.path.join("scATAnno-main/case_study", output_name)
os.makedirs(out_dir, exist_ok=True)

reference_data_path = "PBMC_reference_atlas_final.h5ad"
reference_data = scATAnno_preprocess.load_reference_data(reference_data_path)
query_data = scATAnno_preprocess.import_query_data(path = 'PBMC10k_multiome_vPBMCatlas/scATAC/',
                                    mtx_file = 'matrix.mtx.gz',
                                    cells_file = 'barcodes.tsv.gz',
                                    features_file = 'features.tsv.gz',
                                    variable_prefix = "pbmc10k_query",
                                    celltype_col = "celltypes",
                                    add_metrics=False)
Before performing integration, we check feature dimensions of the reference and query.
[6]:
print(reference_data)
print(query_data)
assert reference_data.var.shape[0] == query_data.var.shape[0]
AnnData object with n_obs × n_vars = 39441 × 196618
    obs: 'celltypes', 'tissue', 'dataset'
View of AnnData object with n_obs × n_vars = 11909 × 196618
    obs: 'celltypes', 'tissue', 'dataset'
We integrate the reference atlas and query data using SnapATAC2 by 1) concatenating two datasets and selecting highly informative “landmark” reference cells to compute similarity matrix, normalize the matrix and eigen decompositionand and 2) performing Nystrom extension to project the remaining reference and query cells onto the same spectral embedding space
[7]:
# Integrate reference and query data
integrated_adata = scATAnno_assignment.scATAnno_integrate(reference_data, query_data, variable_prefix = "pbmc10k_query", sample_size = 25000)
/Users/francis/Desktop/scATAnno-main/scATAnno/SnapATAC2_spectral.py:162: ImplicitModificationWarning: Trying to modify attribute `.var` of view, initializing view as actual.
  adata.var["selected"] = selected_features
Compute similarity matrix
Normalization
Perform decomposition
Perform Nystrom extension
100%|██████████████████████████████████████████████████████████████████████████████████████████████████████████████████████████████████████████████████| 3/3 [13:23<00:00, 267.99s/it]
The following method provides an alternative way to obtain “integrated_adata” (the box above). This method uses all reference samples. The time to calculate “integrated_adata” drops significantly (as only the “Perform Nystrom extension” step is performed) while the accuracy only have a minimal decrease.
[8]:
# First we need to specify the paths for features and models:
# feature_file = "reference_embedding_features.csv"
# model_file ="reference_embedding_model.model"

# You can build the model from prep_data/scATAnno-reference-building-example, or download these files from:
# !wget -O reference_embedding_model.model "https://www.dropbox.com/scl/fi/fgh2vw5jk7g4q68n9k9m7/reference_embedding_model.model?rlkey=6q6n5p5hntqaje7oeqtwezdn4&st=pewaytgz&dl=0"
# !wget -O reference_embedding_features.csv "https://www.dropbox.com/scl/fi/xa6cdy95oqktpy95bw6h8/reference_embedding_features.csv?rlkey=u1of7llfxvdz736bj3txzn0lx&st=e8la05zx&dl=0"

#with both feature_file and model_file for our reference, we can project the data from query_data to the reference data in the spectral space:
#integrated_adata = scATAnno_assignment.scATAnno_query_projection(reference_data, query_data, feature_file, model_file)
Next, apply harmony to spectral embeddings of integrated data to regress out batch effects indicated in batch_col.
[9]:
# Apply harmony to remove batch effects
integrated_adata_harmony = scATAnno_assignment.scATAnno_harmony(integrated_adata, batch_col = "dataset")
2025-01-10 01:01:07,599 - harmonypy - INFO - Computing initial centroids with sklearn.KMeans...
2025-01-10 01:01:07 - INFO - Computing initial centroids with sklearn.KMeans...
2025-01-10 01:01:14,439 - harmonypy - INFO - sklearn.KMeans initialization complete.
2025-01-10 01:01:14 - INFO - sklearn.KMeans initialization complete.
2025-01-10 01:01:14,566 - harmonypy - INFO - Iteration 1 of 20
2025-01-10 01:01:14 - INFO - Iteration 1 of 20
2025-01-10 01:01:25,173 - harmonypy - INFO - Iteration 2 of 20
2025-01-10 01:01:25 - INFO - Iteration 2 of 20
2025-01-10 01:01:35,250 - harmonypy - INFO - Iteration 3 of 20
2025-01-10 01:01:35 - INFO - Iteration 3 of 20
2025-01-10 01:01:45,520 - harmonypy - INFO - Iteration 4 of 20
2025-01-10 01:01:45 - INFO - Iteration 4 of 20
2025-01-10 01:01:55,620 - harmonypy - INFO - Iteration 5 of 20
2025-01-10 01:01:55 - INFO - Iteration 5 of 20
2025-01-10 01:02:07,263 - harmonypy - INFO - Converged after 5 iterations
2025-01-10 01:02:07 - INFO - Converged after 5 iterations
[10]:
integrated_adata_harmony
[10]:
AnnData object with n_obs × n_vars = 51350 × 196618
    obs: 'celltypes', 'tissue', 'dataset'
    obsm: 'X_spectral', 'X_spectral_harmony'
we then plot UMAP of the integrated data using harmonized spectral embeddings. Optionally, we can save the AnnData object in an output directory.
[11]:
# Plot UMAP using spectral embeddings
integrated_adata = scATAnno_assignment.scATAnno_umap(integrated_adata_harmony, out_dir, use_rep = "X_spectral_harmony", save = True)
integrated_adata
/opt/anaconda3/envs/scATAnno/lib/python3.11/site-packages/tqdm/auto.py:21: TqdmWarning: IProgress not found. Please update jupyter and ipywidgets. See https://ipywidgets.readthedocs.io/en/stable/user_install.html
  from .autonotebook import tqdm as notebook_tqdm
/opt/anaconda3/envs/scATAnno/lib/python3.11/site-packages/umap/umap_.py:1952: UserWarning: n_jobs value 1 overridden to 1 by setting random_state. Use no seed for parallelism.
  warn(
OMP: Info #276: omp_set_nested routine deprecated, please use omp_set_max_active_levels instead.
... storing 'celltypes' as categorical
... storing 'tissue' as categorical
[11]:
AnnData object with n_obs × n_vars = 51350 × 196618
    obs: 'celltypes', 'tissue', 'dataset'
    obsm: 'X_spectral', 'X_spectral_harmony', 'X_umap'
[12]:
scATAnno_plotting.defaultPlotting_umap()
sc.pl.umap(integrated_adata, color="dataset", palette = ['#228833', '#cccccc'], show=True, title = "Integration")
... storing 'celltypes' as categorical
... storing 'tissue' as categorical

We investigated cell types in the PBMC reference atlas and re-annotated gamma delta T cell cluster as MAIT cell cluster by showing chromatin accessibility of gene signatures in this cluster.
After integration, we want to assign cell types to the query data by taking three steps. First, query cells are assigned labels using K-Nearest neighbors along with KNN-based uncertainty score. Second, query cell labels are corrected using weighted-distance-based uncertainty score. Third, query cells are clustered and annotated at the cluster level.
[13]:
uncertainty_threshold = 0.2
distance_threshold = 90
reference_label_col = "celltypes"
use_rep = "X_spectral_harmony"
atlas = "PBMC"

integrated_adata = sc.read_h5ad(os.path.join(out_dir, "1.Merged_query_reference.h5ad"))
integrated_adata = scATAnno_preprocess.add_variable(os.path.join(out_dir, "X_spectral_harmony.csv"), integrated_adata)
reference = integrated_adata[integrated_adata.obs['dataset'] == "Atlas", :].copy()
query = integrated_adata[integrated_adata.obs['dataset'] != "Atlas",:].copy()
# Perform KNN assignment
query_KNN = scATAnno_assignment.scATAnno_KNN_assign(reference, query, reference_label_col=reference_label_col, low_dim_col=use_rep)
[14]:
import pickle
with open(('reference_palette.pickle'), 'rb') as handle:
    celltype_palette = pickle.load(handle)

scATAnno_plotting.defaultPlotting_umap()
sc.pl.umap(reference, color="celltypes", palette = celltype_palette, title = "PBMC Reference Atlas")

[15]:
# Perform weighted-distance based assignment
query_distance = scATAnno_assignment.scATAnno_distance_assign(reference, query_KNN, reference_label_col=reference_label_col, distance_threshold=distance_threshold, atlas=atlas, uncertainty_threshold=uncertainty_threshold, use_rep = use_rep)
Embedding shape: (1477, 30)
Centroid shape: (30,)
[16]:
# Perform cluster-level assignment
query_annotated = scATAnno_assignment.scATAnno_cluster_assign(query_distance, cluster_col = None, use_rep=use_rep)
query_annotated
[16]:
AnnData object with n_obs × n_vars = 11909 × 196618
    obs: 'celltypes', 'tissue', 'dataset', 'uncertainty_score_step1', 'pred_y', 'uncertainty_score_step2', 'Uncertainty_Score', '1.knn-based_celltype', '2.corrected_celltype', 'leiden', 'cluster_annotation'
    uns: 'neighbors', 'umap', 'leiden'
    obsm: 'X_umap', 'X_spectral_harmony', 'kernel_distance', 'distance', 'indices', 'neighbors_labels'
    obsp: 'distances', 'connectivities'
[17]:
sc.pl.umap(query_annotated, color = "cluster_annotation",palette=celltype_palette, title = "scATAnno Annotation")
... storing 'pred_y' as categorical
... storing '1.knn-based_celltype' as categorical
... storing '2.corrected_celltype' as categorical
... storing 'cluster_annotation' as categorical

We benchmark scATAnno results with seurat annotation. Seurat annotation is stored in “Seurat_RNA_annotation.csv”
[18]:
seurat_df = pd.read_csv(os.path.join("PBMC10k_multiome_vPBMCatlas/","Seurat_RNA_annotation.csv"), index_col=0)
query_annotated = query_annotated[query_annotated.obs.index.isin(seurat_df.index)]
query_annotated.obs = pd.merge(query_annotated.obs, seurat_df, left_index=True, right_index=True)
query_annotated
[18]:
AnnData object with n_obs × n_vars = 10412 × 196618
    obs: 'celltypes', 'tissue', 'dataset', 'uncertainty_score_step1', 'pred_y', 'uncertainty_score_step2', 'Uncertainty_Score', '1.knn-based_celltype', '2.corrected_celltype', 'leiden', 'cluster_annotation', 'seurat_rna_annotations', 'seurat_new_annotation'
    uns: 'neighbors', 'umap', 'leiden', 'cluster_annotation_colors'
    obsm: 'X_umap', 'X_spectral_harmony', 'kernel_distance', 'distance', 'indices', 'neighbors_labels'
    obsp: 'distances', 'connectivities'
[19]:
sc.pl.umap(query_annotated, color = "seurat_new_annotation", title = "Seurat Annotation", palette = default_28)
... storing 'seurat_rna_annotations' as categorical
... storing 'seurat_new_annotation' as categorical

Lastly, we compare the annotation results between scATAnno and Seurat.
[20]:
outcomes2 = []
for i in query_annotated.obs["cluster_annotation"].index:
    if query_annotated.obs.loc[i,"cluster_annotation"] == query_annotated.obs.loc[i,"seurat_new_annotation"]:
        outcomes2.append("Consistent")
    elif query_annotated.obs.loc[i,"cluster_annotation"] == "unknown":
        outcomes2.append("Unknown")
    else: outcomes2.append("Inconsistent")
query_annotated.obs["outcomes2"] = outcomes2
sc.pl.umap(query_annotated, color = "outcomes2", palette= ['#1f77b4','#ff7f0e','#279e68'], title = "Comparison")
... storing 'outcomes2' as categorical

[21]:
outcomes = []
for i in query_annotated.obs["cluster_annotation"].index:
    if query_annotated.obs.loc[i,"cluster_annotation"] == query_annotated.obs.loc[i,"seurat_new_annotation"]:
        outcomes.append("Consistent")
    else: outcomes.append("Inconsistent")
query_annotated.obs["outcomes"] = outcomes

adata_query = query_annotated.copy()
variable_col = "cluster_annotation"
outcome_col = "outcomes"
listdict = []
for ct in adata_query.obs[variable_col].unique():
    # print(len(adata_query.obs[adata_query.obs['tissue'] == ct]))
    tmp_dict = {}
    for pt in np.unique(adata_query.obs[outcome_col]):
        tmp_dict[pt] = (
            np.sum(
                adata_query.obs[adata_query.obs[variable_col] == ct][outcome_col] == pt
            )
            # / len(adata_query.obs[adata_query.obs[variable_col] == ct])
        )
    l = len(adata_query.obs[adata_query.obs[variable_col] == ct])
    tmp_dict['ct'] = f'{ct} ({l})'
    tmp_dict['n_cells'] = len(adata_query.obs[adata_query.obs[variable_col] == ct])
    listdict.append(tmp_dict)


df = pd.DataFrame(listdict).set_index('ct').sort_values(by='ct')
df = df.iloc[0:df.shape[0]-1].sort_values("n_cells", ascending=True)
print(df)
                             Consistent  Inconsistent  n_cells
ct
pDC (89)                             89             0       89
MAIT (123)                          111            12      123
Treg (146)                          114            32      146
cDC (213)                           185            28      213
Naive B (351)                         3           348      351
NK (389)                            383             6      389
Memory B (492)                        7           485      492
Effector memory CD8 T (732)         581           151      732
Memory CD4 T (1185)                1118            67     1185
Naive CD4 T (1315)                 1203           112     1315
Naive CD8 T (1386)                 1320            66     1386
Monocyte (2788)                    2746            42     2788
[22]:
fig, ax = plt.subplots(1, 1, figsize=(2, 6))
df[df.columns[0:len(df.columns)-1]].plot(kind='barh', stacked=True, ax=ax, width=1.0)
ax.set_xticklabels(ax.get_xticklabels(), fontsize=15)
ax.set_xlabel('Cell Numbers')
ax.set_ylabel('')
ax.legend(bbox_to_anchor=(1.05, 1), loc=2, borderaxespad=0., frameon=False)
ax.grid(False)
sns.despine()
plt.show()
/var/folders/dq/79h3g1bj0rjb4wvj5r5c3w1h0000gn/T/ipykernel_60690/2726220942.py:3: UserWarning: set_ticklabels() should only be used with a fixed number of ticks, i.e. after set_ticks() or using a FixedLocator.
  ax.set_xticklabels(ax.get_xticklabels(), fontsize=15)

[23]:
query_annotated.obs
[23]:
| celltypes | tissue | dataset | uncertainty_score_step1 | pred_y | uncertainty_score_step2 | Uncertainty_Score | 1.knn-based_celltype | 2.corrected_celltype | leiden | cluster_annotation | seurat_rna_annotations | seurat_new_annotation | outcomes2 | outcomes | |
|---|---|---|---|---|---|---|---|---|---|---|---|---|---|---|---|
| TCAAGAACAGTAATAG-1_pbmc10k_query | pbmc10k_query | pbmc10k_query | pbmc10k_query | 3.666667e-01 | Treg | 1.0 | 1.000000e+00 | unknown | unknown | 32 | Treg | CD4 Naive | Naive CD4 T | Inconsistent | Inconsistent |
| AACCCGCAGGTAGCTT-1_pbmc10k_query | pbmc10k_query | pbmc10k_query | pbmc10k_query | 3.666667e-01 | Central memory CD8 T | 0.0 | 3.666667e-01 | unknown | unknown | 10 | Effector memory CD8 T | gdT | Gamma delta T | Inconsistent | Inconsistent |
| CGCATATAGGTTACGT-1_pbmc10k_query | pbmc10k_query | pbmc10k_query | pbmc10k_query | 1.110223e-16 | Memory CD4 T | 0.0 | 1.110223e-16 | Memory CD4 T | Memory CD4 T | 3 | Memory CD4 T | CD4 TCM | Memory CD4 T | Consistent | Consistent |
| TATTCGTTCCGCCTCA-1_pbmc10k_query | pbmc10k_query | pbmc10k_query | pbmc10k_query | 1.110223e-16 | Monocyte | 0.0 | 1.110223e-16 | Monocyte | Monocyte | 0 | Monocyte | CD14 Mono | Monocyte | Consistent | Consistent |
| CGGTTTGAGTTTGGTA-1_pbmc10k_query | pbmc10k_query | pbmc10k_query | pbmc10k_query | 0.000000e+00 | Effector memory CD8 T | 0.0 | 0.000000e+00 | Effector memory CD8 T | Effector memory CD8 T | 8 | Effector memory CD8 T | gdT | Gamma delta T | Inconsistent | Inconsistent |
| ... | ... | ... | ... | ... | ... | ... | ... | ... | ... | ... | ... | ... | ... | ... | ... |
| GGTCAAGCACCTACTT-1_pbmc10k_query | pbmc10k_query | pbmc10k_query | pbmc10k_query | 0.000000e+00 | Monocyte | 0.0 | 0.000000e+00 | Monocyte | Monocyte | 0 | Monocyte | CD14 Mono | Monocyte | Consistent | Consistent |
| CTTGCTCAGACAAACG-1_pbmc10k_query | pbmc10k_query | pbmc10k_query | pbmc10k_query | 1.110223e-16 | Monocyte | 1.0 | 1.000000e+00 | Monocyte | unknown | 15 | unknown | CD16 Mono | Monocyte | Unknown | Inconsistent |
| GAAAGCCAGCAGGTGG-1_pbmc10k_query | pbmc10k_query | pbmc10k_query | pbmc10k_query | -2.220446e-16 | Monocyte | 0.0 | 0.000000e+00 | Monocyte | Monocyte | 25 | Monocyte | CD14 Mono | Monocyte | Consistent | Consistent |
| ACGGGAAGTGTTAGCA-1_pbmc10k_query | pbmc10k_query | pbmc10k_query | pbmc10k_query | 0.000000e+00 | Naive CD8 T | 0.0 | 0.000000e+00 | Naive CD8 T | Naive CD8 T | 6 | Naive CD8 T | CD8 Naive | Naive CD8 T | Consistent | Consistent |
| CTATGATCACCATATG-1_pbmc10k_query | pbmc10k_query | pbmc10k_query | pbmc10k_query | -2.220446e-16 | Monocyte | 0.0 | 0.000000e+00 | Monocyte | Monocyte | 11 | Monocyte | CD14 Mono | Monocyte | Consistent | Consistent |
10412 rows × 15 columns
[24]:
query_annotated.write(os.path.join(out_dir, "query_annotated.h5ad"))
... storing 'outcomes' as categorical
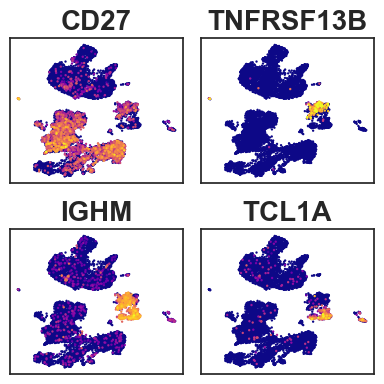
To examine B cell subtypes, we leverage scRNA-profile to show signature genes
[25]:
# Read in scRNA profile
RNA_anndata = sc.read_10x_h5("PBMC10k_multiome_vPBMCatlas/scRNA/pbmc_granulocyte_sorted_10k_filtered_feature_bc_matrix.h5")
RNA_anndata.obs.index = [ i+ "_pbmc10k_query" for i in RNA_anndata.obs.index]
RNA_anndata = RNA_anndata[RNA_anndata.obs.index.isin(query_annotated.obs.index)]
/opt/anaconda3/envs/scATAnno/lib/python3.11/site-packages/anndata/_core/anndata.py:1820: UserWarning: Variable names are not unique. To make them unique, call `.var_names_make_unique`.
  utils.warn_names_duplicates("var")
/opt/anaconda3/envs/scATAnno/lib/python3.11/site-packages/anndata/_core/anndata.py:1820: UserWarning: Variable names are not unique. To make them unique, call `.var_names_make_unique`.
  utils.warn_names_duplicates("var")
[26]:
RNA_anndata
[26]:
View of AnnData object with n_obs × n_vars = 10412 × 36601
    var: 'gene_ids', 'feature_types', 'genome', 'interval'
[27]:
RNA_anndata.obs = pd.merge(RNA_anndata.obs, query_annotated.obs[["cluster_annotation", "seurat_new_annotation"]], left_index=True, right_index=True)
UMAP_df = pd.DataFrame(query_annotated.obsm["X_umap"])
UMAP_df.index = query_annotated.obs.index
UMAP_df.columns = ["UMAP_1", "UMAP_2"]
UMAP_df = UMAP_df.loc[RNA_anndata.obs.index]
RNA_anndata.obsm["X_umap"] = np.array(UMAP_df)
new_categories = np.unique(query_annotated.obs["cluster_annotation"])
RNA_anndata.obs["cluster_annotation"] = RNA_anndata.obs["cluster_annotation"].cat.set_categories(new_categories)
/opt/anaconda3/envs/scATAnno/lib/python3.11/site-packages/anndata/_core/anndata.py:1820: UserWarning: Variable names are not unique. To make them unique, call `.var_names_make_unique`.
  utils.warn_names_duplicates("var")
/opt/anaconda3/envs/scATAnno/lib/python3.11/site-packages/anndata/_core/anndata.py:1820: UserWarning: Variable names are not unique. To make them unique, call `.var_names_make_unique`.
  utils.warn_names_duplicates("var")
[28]:
RNA_anndata.obs
[28]:
| cluster_annotation | seurat_new_annotation | |
|---|---|---|
| AAACAGCCAAGGAATC-1_pbmc10k_query | unknown | Naive CD4 T |
| AAACAGCCAATCCCTT-1_pbmc10k_query | Memory CD4 T | Memory CD4 T |
| AAACAGCCAATGCGCT-1_pbmc10k_query | Naive CD4 T | Naive CD4 T |
| AAACAGCCACCAACCG-1_pbmc10k_query | Naive CD8 T | Naive CD8 T |
| AAACAGCCAGGATAAC-1_pbmc10k_query | Naive CD4 T | Naive CD4 T |
| ... | ... | ... |
| TTTGTTGGTGACATGC-1_pbmc10k_query | Naive CD8 T | Naive CD8 T |
| TTTGTTGGTGTTAAAC-1_pbmc10k_query | Naive CD8 T | Naive CD8 T |
| TTTGTTGGTTAGGATT-1_pbmc10k_query | NK | NK |
| TTTGTTGGTTGGTTAG-1_pbmc10k_query | Memory CD4 T | Memory CD4 T |
| TTTGTTGGTTTGCAGA-1_pbmc10k_query | Effector memory CD8 T | Effector memory CD8 T |
10412 rows × 2 columns
[29]:
sc.pp.filter_genes(RNA_anndata, min_cells=3)
sc.pp.normalize_total(RNA_anndata, target_sum=1e4)
sc.pp.log1p(RNA_anndata)
sc.pp.highly_variable_genes(RNA_anndata, min_mean=0.0125, max_mean=3, min_disp=0.5)
sc.pp.scale(RNA_anndata, max_value=10)
RNA_anndata.var_names_make_unique()
/opt/anaconda3/envs/scATAnno/lib/python3.11/site-packages/anndata/_core/anndata.py:1820: UserWarning: Variable names are not unique. To make them unique, call `.var_names_make_unique`.
  utils.warn_names_duplicates("var")
[30]:
N_col = 2
N_row = 2

markergenes = ["CD27","TNFRSF13B", # memoryB
              "IGHM", "TCL1A", # naive B
              ]
fig, axes=plt.subplots(nrows= N_row , ncols= N_col , figsize=(N_col*2,N_row*2),
                       sharex=True,sharey=True, )
for i in range(len(markergenes) ):
    i_row = int(i/N_col)
    i_col = i%N_col
    ax = axes[i_row, i_col]
    sc.pl.umap(RNA_anndata, color= markergenes[i],
                    title =  markergenes[i],
               # title = "",
               show=False, ax = ax, legend_loc=None,color_map='plasma', colorbar_loc = None, )
    ax.set_xlabel('')
    ax.set_ylabel('')
fig.tight_layout()
plt.show()
... storing 'feature_types' as categorical
... storing 'genome' as categorical
... storing 'interval' as categorical
We have integrated a new module into scATAnno specifically designed to identify cell type-specific peaks. This module utilizes the marker_regions function from SnapATAC2, with an average runtime of just 5 seconds for 5,000 cells.
[31]:
marker_peaks = snap.tl.marker_regions(query_annotated, groupby='cluster_annotation', pvalue=0.001)
Plot cell-type specific peaks identified
[32]:
snap.pl.regions(query_annotated, groupby='cluster_annotation', peaks=marker_peaks, interactive=False)
[32]:

The following outputs cell type specific peaks into separate documents.
[33]:
for i in range(len(marker_peaks)):
    key = list(marker_peaks.keys())[i]
    data = marker_peaks[key]
    print(f"Key: {key}, Data size: {len(data)}")
    df = pd.DataFrame(data, columns=['peak'])
    df.to_csv(f'{key}_peak.csv', index=False)
Key: Effector memory CD8 T, Data size: 244
Key: MAIT, Data size: 241
Key: Memory B, Data size: 412
Key: Memory CD4 T, Data size: 260
Key: Monocyte, Data size: 1401
Key: NK, Data size: 366
Key: Naive B, Data size: 237
Key: Naive CD4 T, Data size: 261
Key: Naive CD8 T, Data size: 316
Key: Treg, Data size: 250
Key: cDC, Data size: 608
Key: pDC, Data size: 2050
Key: unknown, Data size: 921